
Change in effective area of similar ecological environments
- The effective area of similar ecological environments is a measure of the total area of land with an environment similar to that of a particular location. It is thus is an index of the amount of suitable habitat available, and thus the potential long-term persistence of biodiversity.
- Change in effective area of similar ecological environments can arise due to climate change, land use practices, or both.
- Change in effective area of similar ecological environments is calculated by first estimating the area of locations that are similar to a particular location at a baseline and under a scenario (climate, land use or both). Change is then expressed for that location as a proportion, dividing the effective area under the scenario by the effective area of the baseline (figure below). This is calculated for every location in Australia.
- If there is a decrease in effective area of similar ecological environments in the future, we expect a corresponding loss of original biodiversity due to loss of suitable habitat.
Click on the boxes below to explore examples at national and regional scales.
-
 Example national context
The national pattern of change in effective area for mammals (as a result of climate change alone) by 2050 under the high emissions’ mild MIROC5 climate scenario is moderate. Greater losses are projected (i.e., reduced capacity to support all the original mammal species) in parts of northern Australia (darker shading), and lesser reduction in effective area (lighter shading) is projected along the southern edges of the continent and in Tasmania.
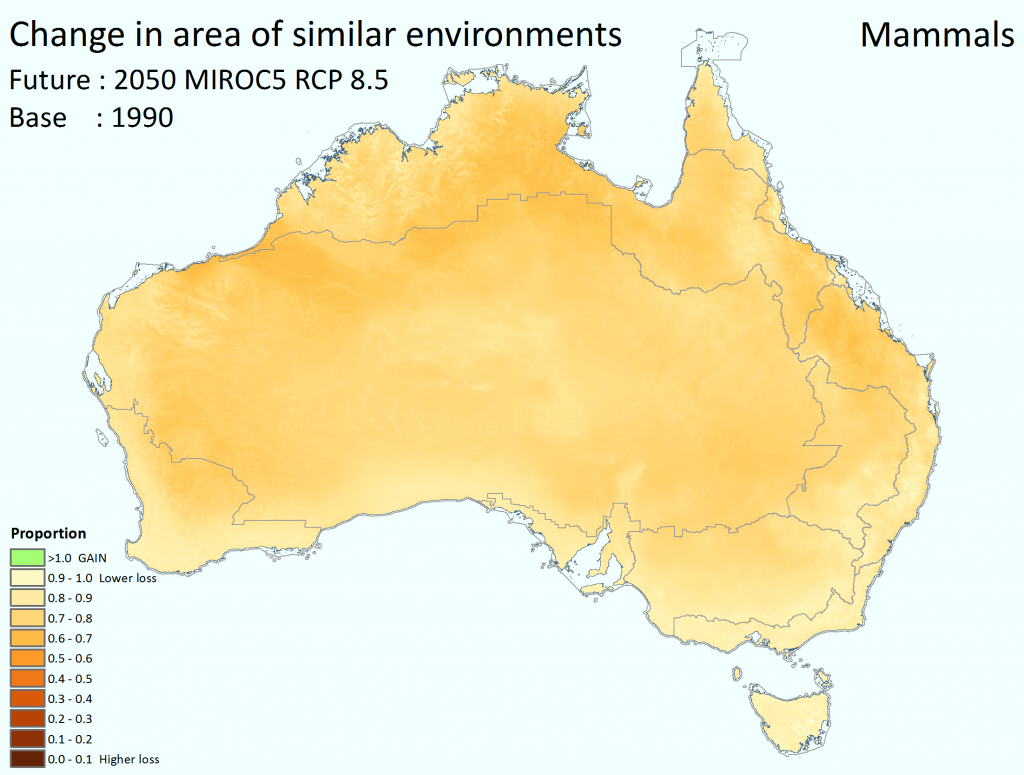
Change in effective area of similar ecological environments for mammals by 2050 using the high emissions’ mild MIROC5 climate scenario and assuming intact habitats. Darker colours signify lower proportion of similar habitat remaining by 2050; lighter colours signify less change and, in some cases, a gain in effective area (green). While the legend shows 10 categories, the mapped data itself is continuous.
The comparable projection of change in effective area for mammals that includes the effects of past land clearing in addition to climate change effects under the high emissions’ mild MIROC5 scenario leads to a much more severe outlook for the intensively utilised agricultural zones of southern and eastern Australia, including parts of Tasmania.
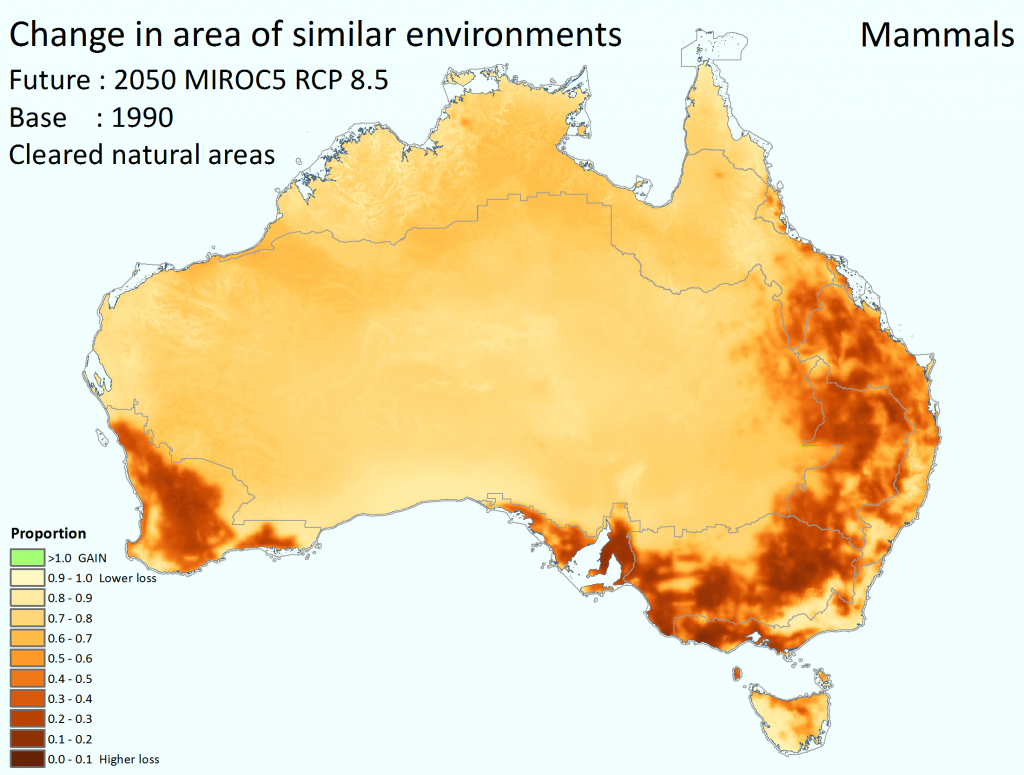
Change in effective area of similar ecological environments for mammals by 2050 using the high emissions’ mild MIROC5 climate scenario with contemporary land clearing patterns. Darker colours signify lower areal proportion of similar habitat remaining by 2050; lighter colours signify less change and, in some cases, a gain in effective area (green). While the legend shows 10 categories, the mapped data itself is continuous.
-
Example regional focus
A regional view of change in effective area for reptiles in Tasmania under the high emissions’ mild MIROC5 scenario suggests considerable local variability in the degree of gain or loss of reptile environments, when considering climate change alone. Some ecological environments, particularly the broad river valleys in the southeast, are showing an increase in the area of suitable habitat (green shading), which is an uncommon projection for most parts of Australia and suggests high buffering potential.
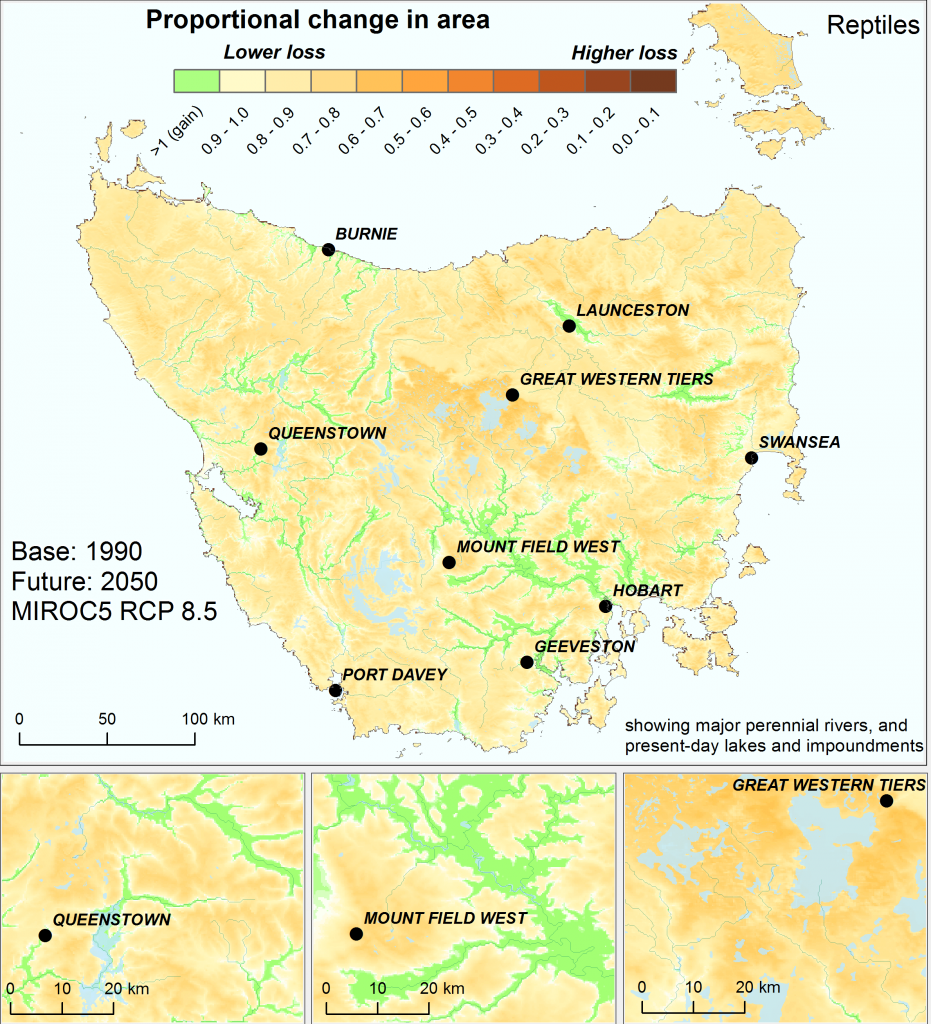
Change in effective area of similar ecological environments for reptiles in Tasmania by 2050, using the high emissions’ mild MIROC5 climate scenario, not accounting for past land clearing. Analysis based on the Australian continent.
However, accounting for the effects of past land clearing in addition to the effects of climate change shows that much of this buffering potential in the state has already been lost.
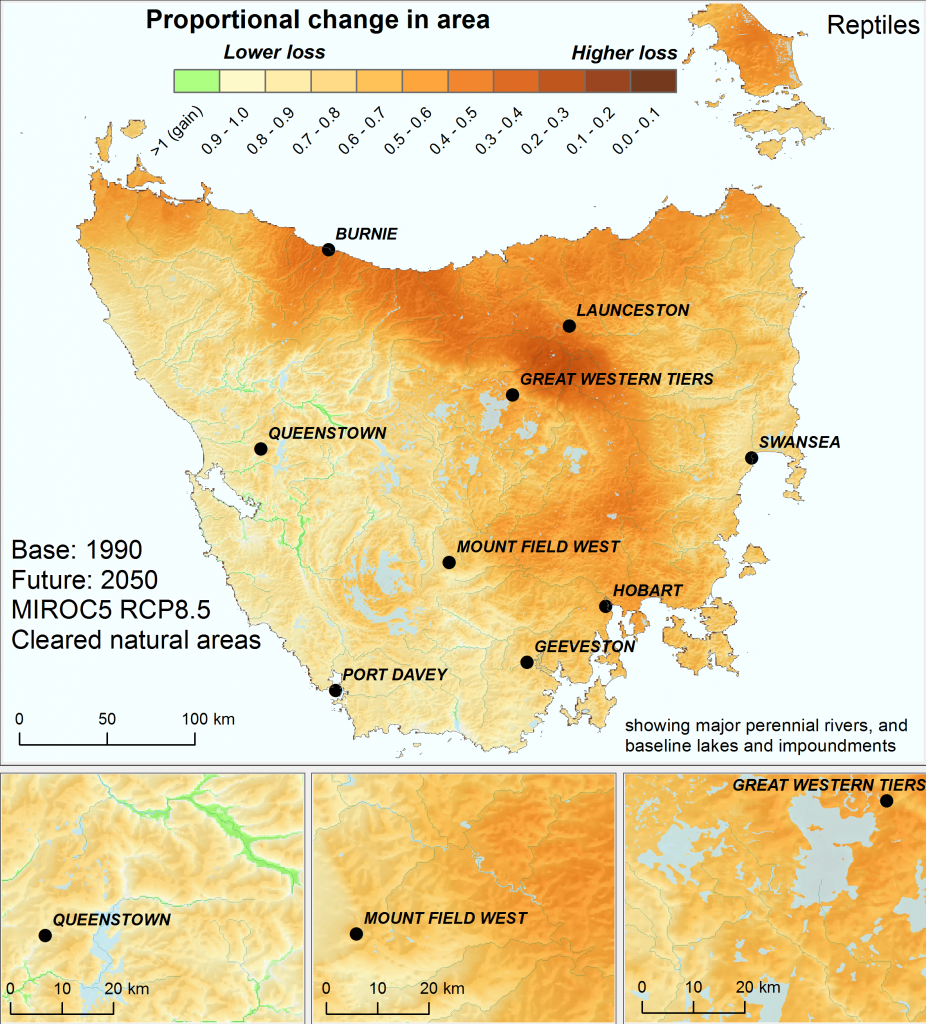
Change in effective area of similar ecological environments for reptiles in Tasmania by 2050, using the high emissions’ mild MIROC5 climate scenario, and including the effects of past land clearing. Analysis based on the Australian continent.
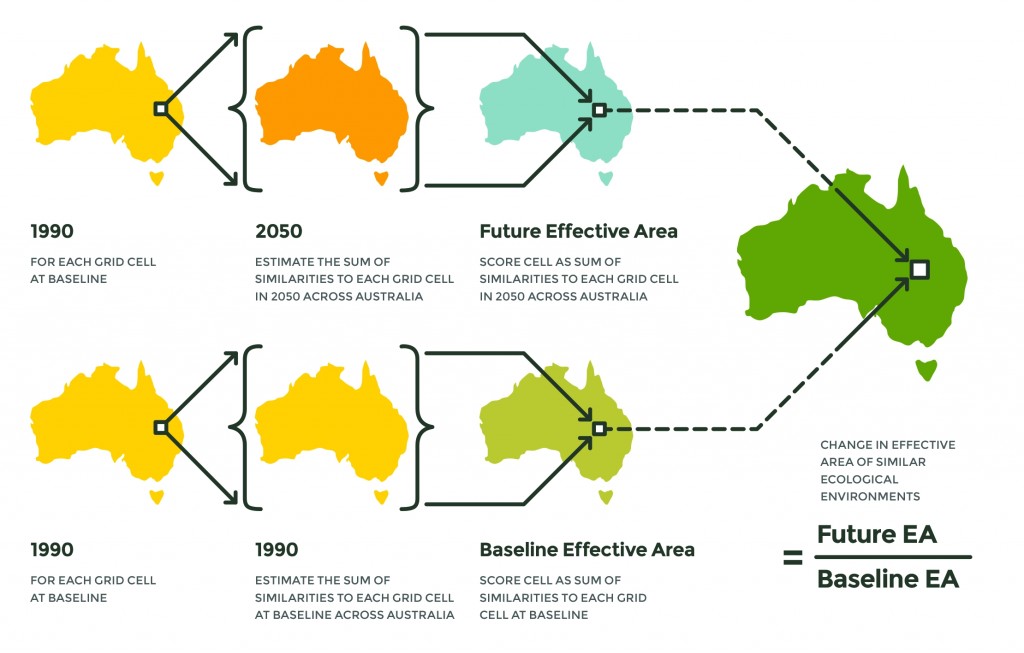
Change in effective area of similar ecological environments is a proportion, derived from two separate calculations.
Ideas for using change in effective area of similar ecological environments in planning are available under Planning Examples.