Composite ecological change
- Measures of the potential degree of change and of disappearing and novel environments can be combined to show not only where change might be greatest, but also something about the nature of the change to recognise different types of change.
- These different types of change may suggest different approaches to adaptation.
- To create a composite view, each of the three component measures are assigned to a colour band (figure below):
- local similarity as shades of green
- novel as shades of blue
- disappearing as shades of red
- The three layers can then be mapped simultaneously, showing the varying degrees of similar, novel and disappearing ecological environments and their combinations. This provides a way to simultaneously express the degree and nature of the ecological change that can be expected.
- There are five broad types of change (figure below):
- Minimal change
- Change but not novel or disappearing
- Disappearing but not becoming novel
- Becoming novel but not disappearing
- Both novel and disappearing
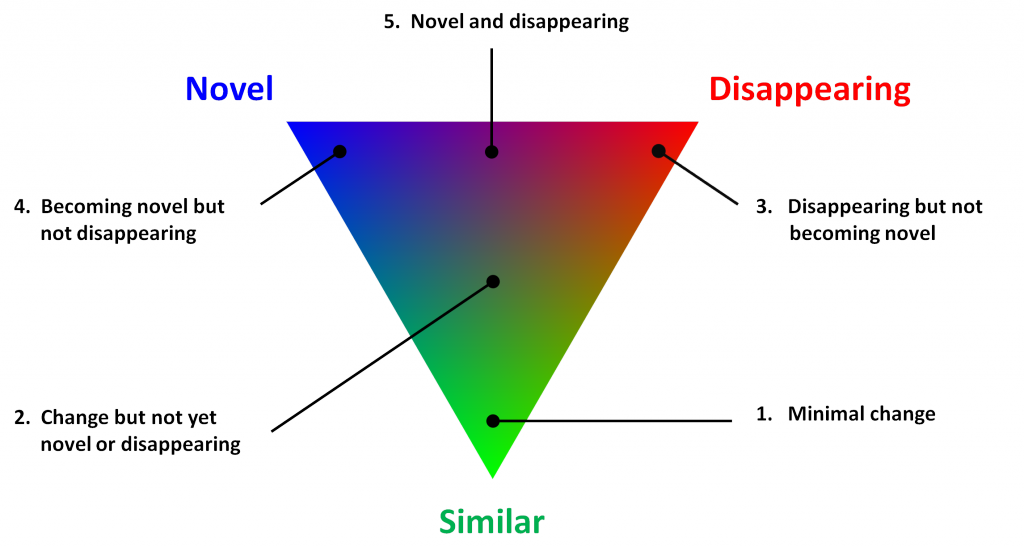
A diagram showing the possible colour combinations arising from the three component measures using RGB scaling in the visible colour spectrum: local similarity as shades of green, novel as shades of blue, and disappearing as shades of red.
Click on the boxes below to explore examples at national and regional scales.
-
 Example national context
From a national perspective, the composite ecological change measure reveals the different spatial patterns and types of change. This figure shows areas of local detail among relatively subdued patterns of ecological change for reptiles under the high emissions’ hot CanESM2 climate scenario.
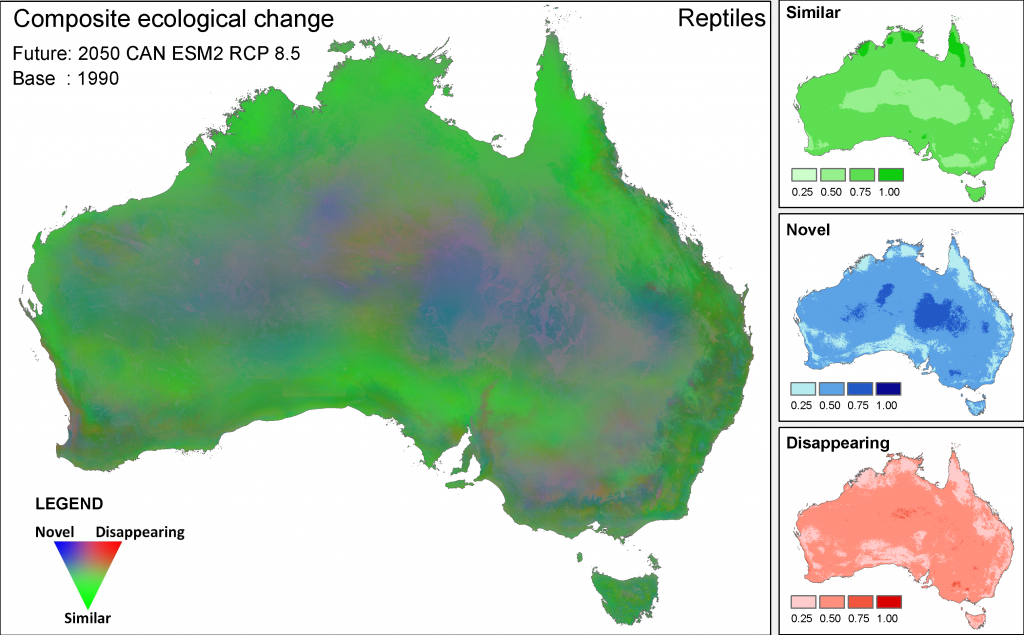
Patterns of composite ecological change for reptiles under the high emissions’ hot CanESM2 climate scenario. This image combines three datasets: the potential degree of ecological change and the degree to which ecological environments are becoming novel and tending to disappear. The images on the right hand side of the figure guide interpretation, but continuous data (rather than the four categories) were used to produce the composite image. Note that the ecological similarity scaling for the novel and disappearing measures has been inverted.
Similar views and interpretation of composite ecological change can be applied to the other biological groups and are accessible in the CSIRO Data Access Portal. Comparing these will show that patterns are different for the different biological groups with varying contrasts between the mild and hotter climate scenarios.
-
Example regional context
Closer examination at the regional scale shows that types of change can vary within a region, and show quite complex patterns. This example shows varying patterns in the types of change that may be experienced by vascular plants under the high emissions’ mild MIROC5 climate scenario in the broader Hunter Valley region of New South Wales.
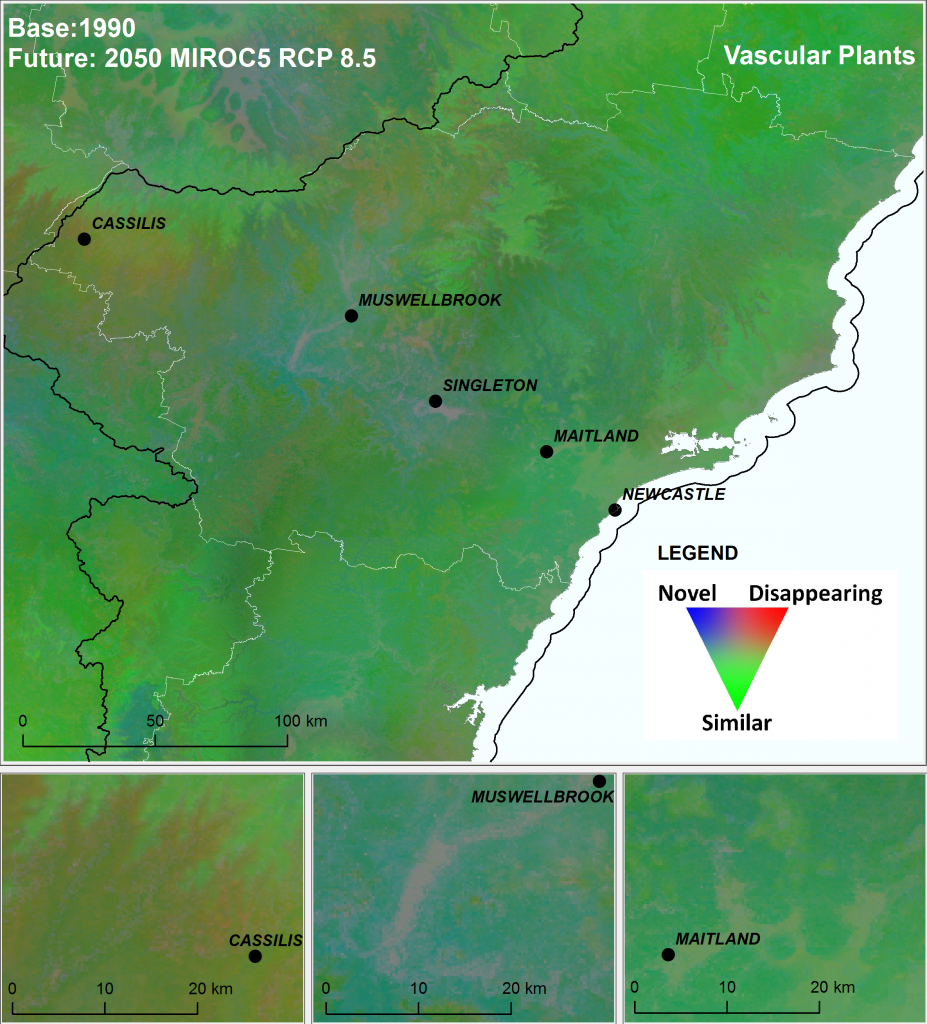
Composite ecological change identified for vascular plants under the high emissions’ mild MIROC5 climate scenario for the greater Hunter Valley region in New South Wales.
For example, the redder-brown areas around the township of Cassilis signify disappearing types of environments where some vascular plant species may be at risk of extinction if these trends continue to deeper red. There is a particularly high degree of dynamism (novel and disappearing environments) projected for much of the Hunter Valley itself.