Viewing biodiversity planning through an adaptation lens suggests that adaptation planning may look very different when compared with traditional approaches to planning of assets, managing or eliminating threats, or even managing resilience of systems as they are today.
- Assessment will need to incorporate assessment of potential change in biodiversity and the nature of the changes, including the consequences for community and stakeholder values and aspirations.
- Strategic Planning will need to consider that different types of changes in biodiversity may need different strategic approaches to manage, and that some current values and objectives may be impossible or impractical to maintain.
- Implementation Planning will need to consider a broad range of approaches, including new innovative actions which will need to be matched to the degree and nature of biodiversity change and may need to be adjusted over time.
This module provides tools to assist with assessment and an indication that different types of change may need different approaches in strategic planning.
Helping Biodiversity Adapt will provide guidance on strategic planning given the nature of biodiversity, and a toolkit for considering implementation options.
To explore ways in which the information presented in this Module might be used in regional planning, click on the topics below.
-
 Using the potential degree of ecological change in vulnerability analyses
During the Assessment phase of planning, Australia’s regional NRM groups often undertake some form of spatial vulnerability or risk analysis – trying to identify parts of their regions that may be particularly under threat. Such assessments usually aim to integrate information on a range of different threats and vulnerabilities for a range of different assets or systems. Climate change is only one part of that bigger picture.
Our models of the potential degree of ecological change can be thought of as layers that integrate exposure and sensitivity to climate change, in the absence of other threats. Thus, they are not complete vulnerability assessments by themselves, but can be combined with other information in integrated assessments to give a more complete picture of differences in vulnerability across a region.
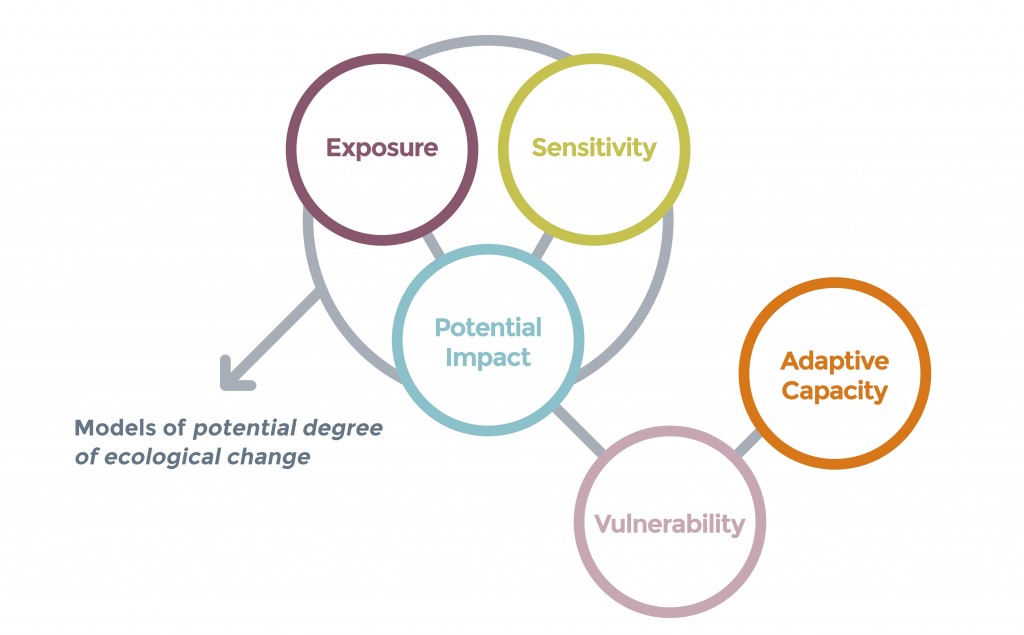
The general structure of vulnerability analyses, showing that models of potential degree of ecological change can be used as the ‘potential impact’ layer – a synthesis of climate exposure and sensitivity. Other threats may be incorporated as reductions to adaptive capacity.
For example, consultants Spatial Vision Innovations, in partnership with Natural Decisions, delivered an Impacts and Vulnerability Assessment for seven Victorian CMAs in July 2014. It represents a significant and very useful synthesis of existing information. However, due to limitations in terms of time and available data, they were only able to include exposure based on two climate variables, and the assessment of sensitivity was restricted to a categorical rating using expert opinion (very common when considering sensitivity separately from exposure).
When the assessment is next updated, the models of potential degree of ecological change for vascular plants presented here could substitute for the exposure and sensitivity variables for native vegetation, providing greater depth and rigour to the assessment of potential impact. This is because our models considered a broad range of climate variables and sensitivity was fully modelled based on the suite of environmental variables, including climate, that determine species compositions. Our models of fauna groups could also be added as additional assets in the analysis if desired.
-
Combining models with local knowledge
The wheatbelt of Western Australia is an area that our vascular plant model suggests will experience a higher potential degree of change, with around 50% of species affected by 2050 even under the milder of our climate scenarios. Local, species-specific knowledge can be used to help confirm these model results. The eastern-most population of Jarrah (Eucalyptus marginata), at Jilakin Rock in the wheatbelt of Western Australia (Shire of Kulin), may be one of the first examples of vegetation change associated with climate stress. This isolated population declined from 74 live (and 55 dead) trees in 1981 to 14 live trees remaining in 2012 (Whitford et al. 2008; Whitford 2012; Peter White, Department of Parks and Wildlife WA, pers. comm.). It has not been possible to attribute the deaths to anything other than prevailing dry conditions (both declining rainfall and a shift in the seasonal distribution of rainfall). Thus, this population may be an early signal of the high potential degree of change in vascular plant species compositions in this region.
However, local knowledge may also supplement model results. Although our models incorporate topographic information at relatively high spatial resolutions (approx 250m grids), they do not include finer-scale microclimatic effects. Local knowledge and experimental evidence suggest that granite rock environments provide moisture buffering, enabling the persistence of some species in places normally considered too dry. In this case, expert knowledge about local fine-scale variation may need to be incorporated into vulnerability assessments, or factored in during more detailed implementation planning.
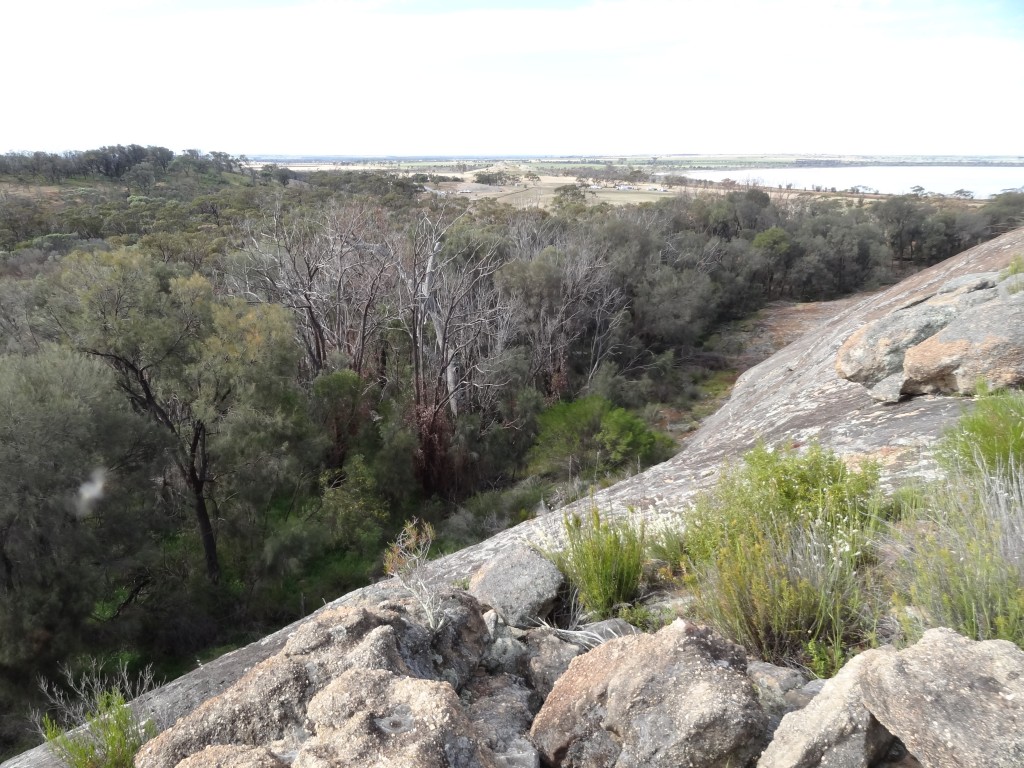
The eastern-most population of Jarrah (Eucalyptus marginata), at Jilakin Rock in the wheatbelt of Western Australia showing tree deaths, but also pockets of survival in certain microclimates. Image: Suzanne Prober.
Whitford K, White P, McCaw L, Durell G, Whitford E (2008). Deaths of jarrah in 2008 at Jilakin Rock: an outlying population of jarrah: a report of initial observations. Unpublished report, Department of Environment and Conservation, Kensington, WA.
Whitford KR (2012) Jilakin jarrah. Western Wildlife: Newsletter of the Land for Wildlife Scheme 16(3), 12–13.
-
Engaging the community about future values
Maps of disappearing environments may provide an ideal way to engage key stakeholders, including community members, in discussions of whether current assets or ‘special places’ of a region will still be viewed as valuable in the future. Focusing on what the community values has become a common foundation of regional NRM planning in Australia, but is currently done in a way that tends to assume that assets like vegetation communities will remain where they currently are. Maps of disappearing environments can highlight where existing special places may be at risk of disappearing, at least in terms of their current species composition. This realisation can be used to explore more deeply why those places are currently highly valued by the community and thus whether their disappearing nature requires special attention in planning. Engaging the community in this process can also help build their capacity to adapt to the future, a core challenge of climate adaptation planning as highlighted in The NRM Adaptation Checklist.
For example, the model of disappearing environments for vascular plants in northern Queensland under the high emissions’ mild MIROC5 climate scenario shows that areas around Port Douglas and areas west and south of Atherton, extending toward the coast around and south of Mission Beach, are all at reasonably high risk of disappearing by 2050. This means that not only is the vegetation composition in these areas likely to be quite different than it is today, but what we currently see in these areas may no longer exist in its current form anywhere in Australia.
These areas are currently all important ecotourism destinations. Will their tourist value decrease as plant composition changes, potentially reducing their ability to support iconic fauna such as cassowaries and tree kangaroos? Or is the experience of nature in general more what tourists are seeking? Distinguishing between these different values associated with the biodiversity of these regions may help determine whether these areas will remain as ‘special places’ in the future or whether the planning focus might be shifted elsewhere.
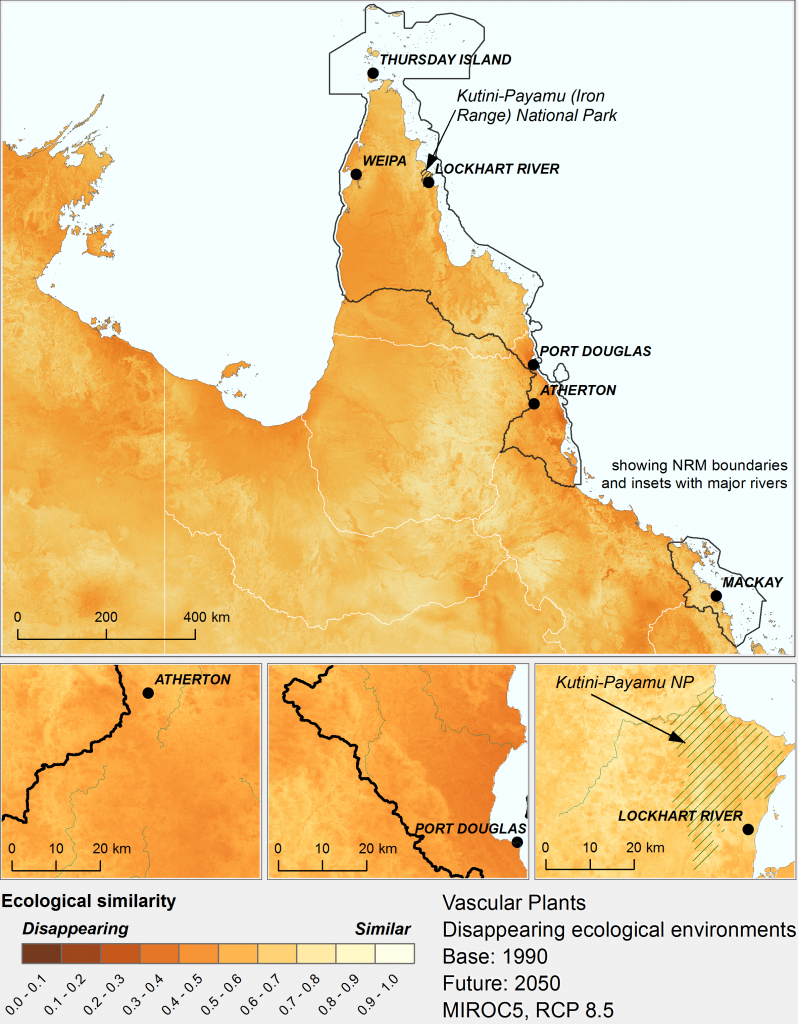
Gradients in the degree to which ecological environments are tending to disappear for vascular plants under the high emissions’ mild MIROC5 climate scenario by 2050, within regions broadly associated with the Wet Tropics. Darker colours signify greater tendency to disappear.
-
Planning for multiple futures
As highlighted in The NRM Adaptation Checklist, one of the core challenges of NRM planning under climate change involves planning for multiple futures. As we can’t know precisely what future climates will arise, decisions made now that may have long-term consequences need to be ones that are likely to be effective under a range of possible future climates. That is why two contrasting climate futures have been modelled for all the measures presented in this module.
While maps based on different climate scenarios may seem strikingly different, robust decisions can still be made by focusing on where differences between climate scenarios primarily occur in the magnitude of impact, but spatial variation in impacts appears similar across scenarios. For example, the images below show regional variation in disappearing environments for mammals in the eastern rangelands under two climate futures. While there is greater risk that environments supporting mammals may disappear under the hot CanESM2 scenario compared to the mild MIROC5 scenario, the patterns of regional variation are similar under both. In general, the southern Lake Eyre Basin region and associated deserts (including the Australian Wildlife Conservancy’s Kalamurina Sanctuary) are less likely to contain mammal environments that will disappear compared to the northern Basin and western Queensland more broadly (including the Australian Wildlife Conservancy’s Bowra Sanctuary). Thus, both climate scenarios suggest that efforts to maintain and restore historical rangeland mammal populations (a key aim of the Australian Wildlife Conservancy) may be more readily achievable in the southern Lake Eyre Basin than in the northern Basin, where different strategic goals and management approaches may be required.
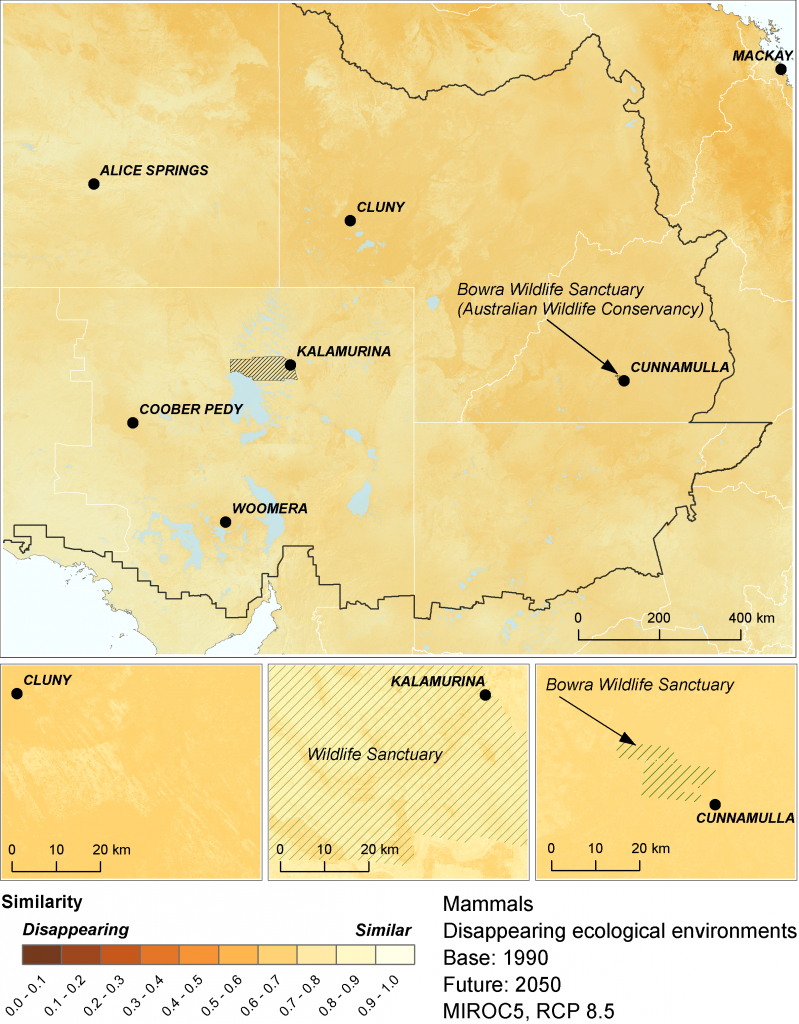
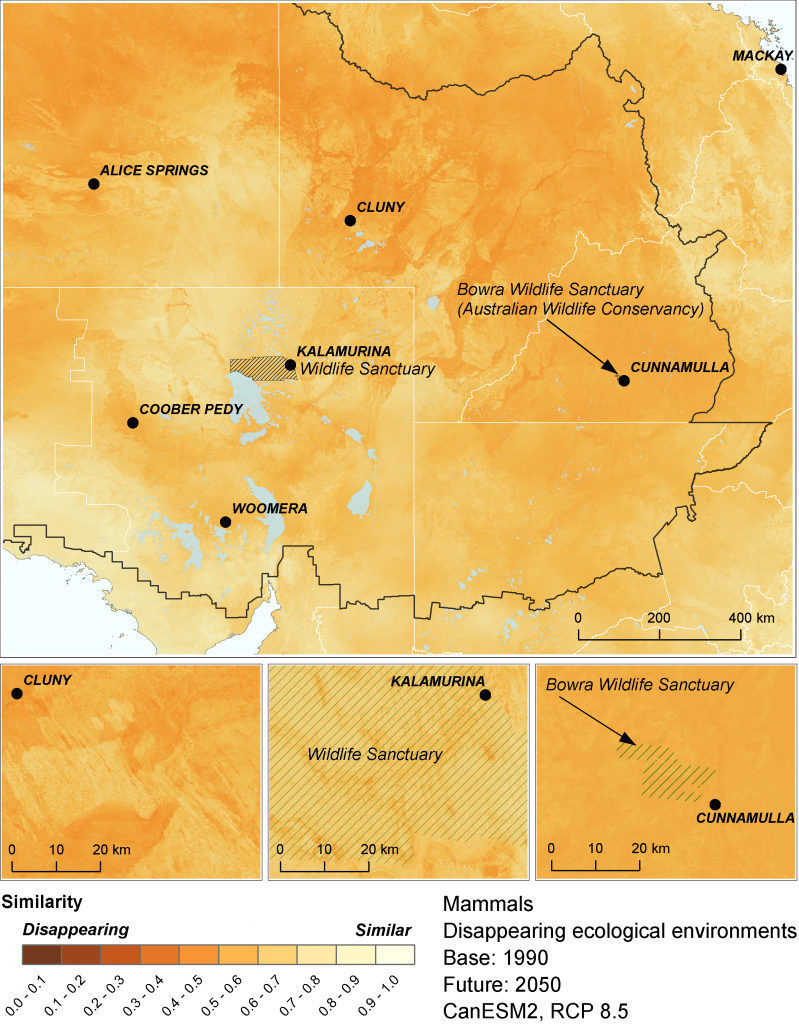
The Degree to which ecological environments are tending to disappear in the eastern Rangelands for mammals by 2050, under the high emissions’ mild MIROC5 climate scenario (top) and the hot CanESM2 climate scenario (bottom). Darker colours signify greater tendency to disappear.
-
Identifying key areas for cross-border collaboration
Information on where novel environments are likely to arise could highlight where cross-border collaboration might be most useful in planning – a key aspect of climate-adapted planning as highlighted in The NRM Adaptation Checklist. The regional focus example below suggests that the amphibian community of the ephemeral lakes and creeks of western Victoria may be under pressure to change such that the future community won’t be much like any amphibian community known today in Australia.
For a novel community to assemble, species that don’t currently live there may need to move into the region. As most amphibians are dependent on hydrological connectivity to move through the landscape, ephemeral flows through the mallee region may be critical to ensuring a new amphibian community can arise and amphibians won’t be lost from the region. Planning for such flows could require collaboration among Mallee, Wimmera, and North Central CMAs, and they may benefit from presenting this cross-border perspective when interacting with existing collaborative water resource planning efforts.
Similarly, the AdaptNRM Module on Weeds and Climate Change highlighted that where novel environments arise, there may be greater risk that the new communities will be composed of or dominated by invasive plant species. Thus, Mallee, Wimmera, and North Central CMAs could also collaborate on a simple monitoring program to try to detect new amphibians coming into the region and assess whether they are acting invasively. Such collaborative monitoring could be particularly cost-effective.
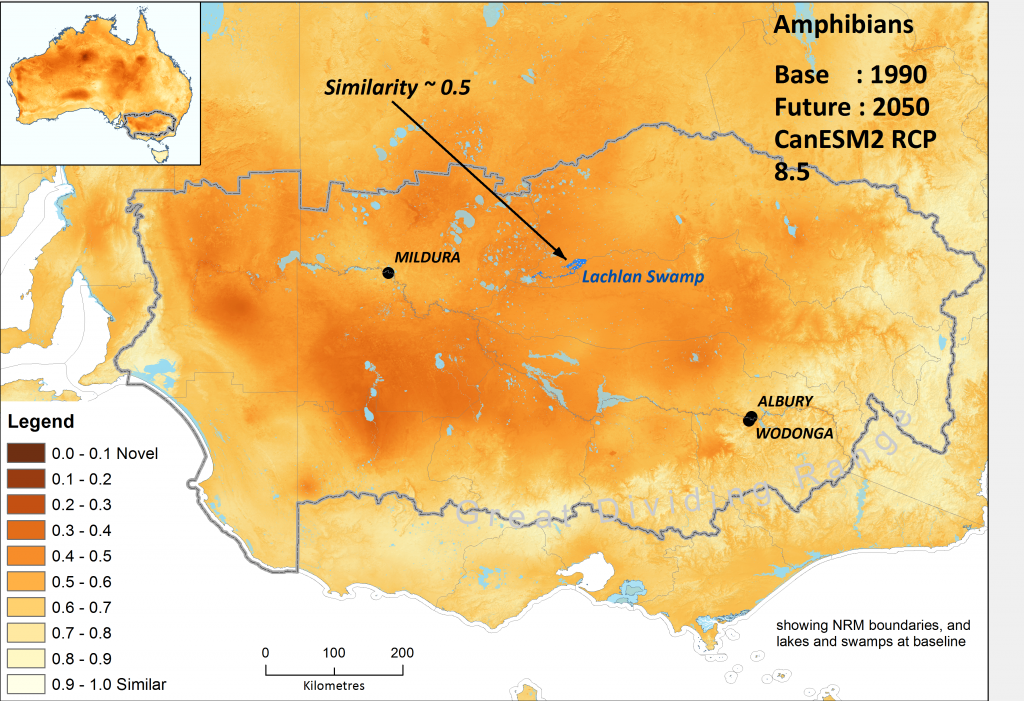
Gradients in the degree to which ecological environments are becoming novel for Australian amphibians under the high emissions’ hot CanESM2 climate scenario by 2050, within regions broadly associated with the lower Murray Basin.
-
Reducing dependence on vegetation as an umbrella
In planning for biodiversity at most scales, there is considerable reliance on vegetation as an umbrella for other species. For example, a great deal of planning is based on vegetation types (e.g. improving the extent of communities like Box-Gum Grassy Woodlands) with an assumption that associated fauna species will also benefit. While that assumption has been questioned in the past, our community-level models of broad shifts in different species groups particularly highlight that vegetation is not necessarily a good indicator of the likely response of other groups under climate change.
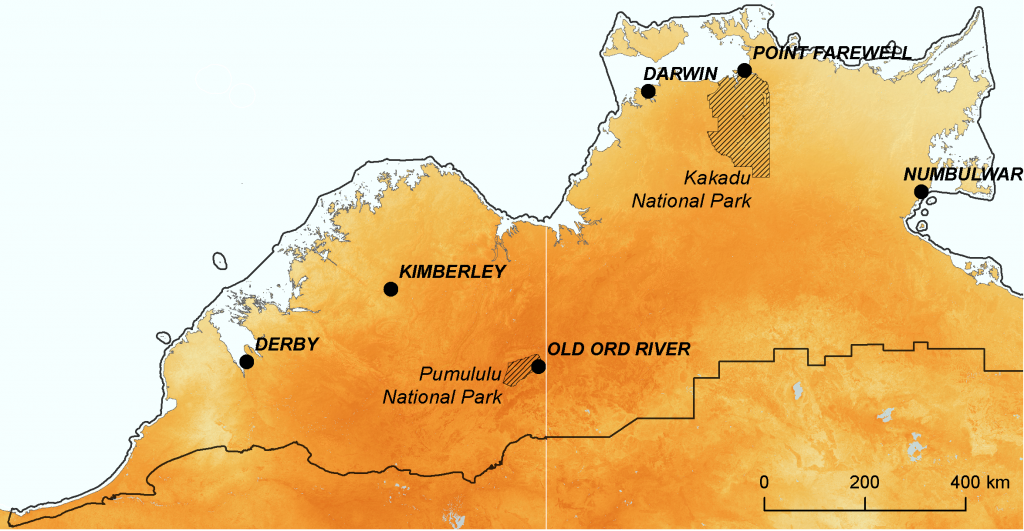
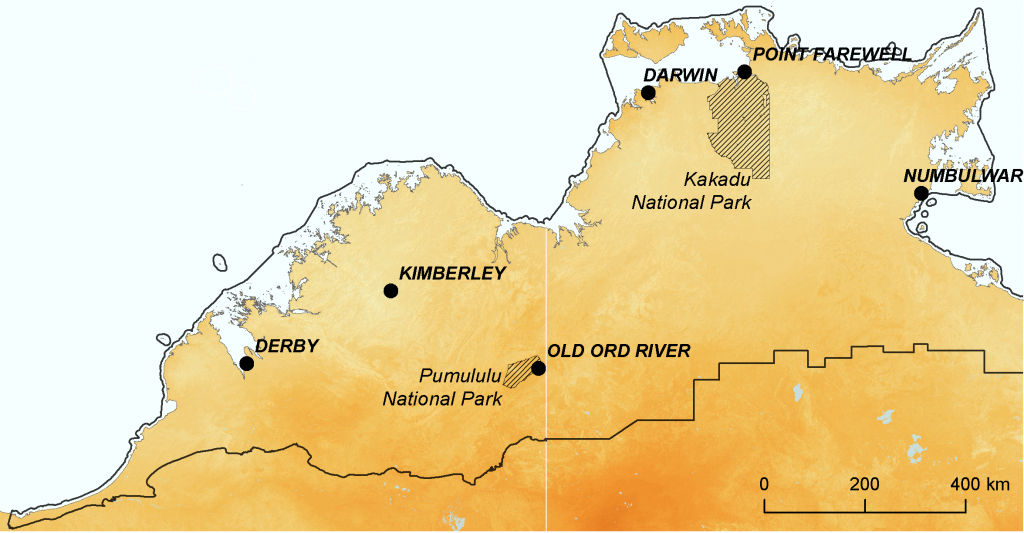
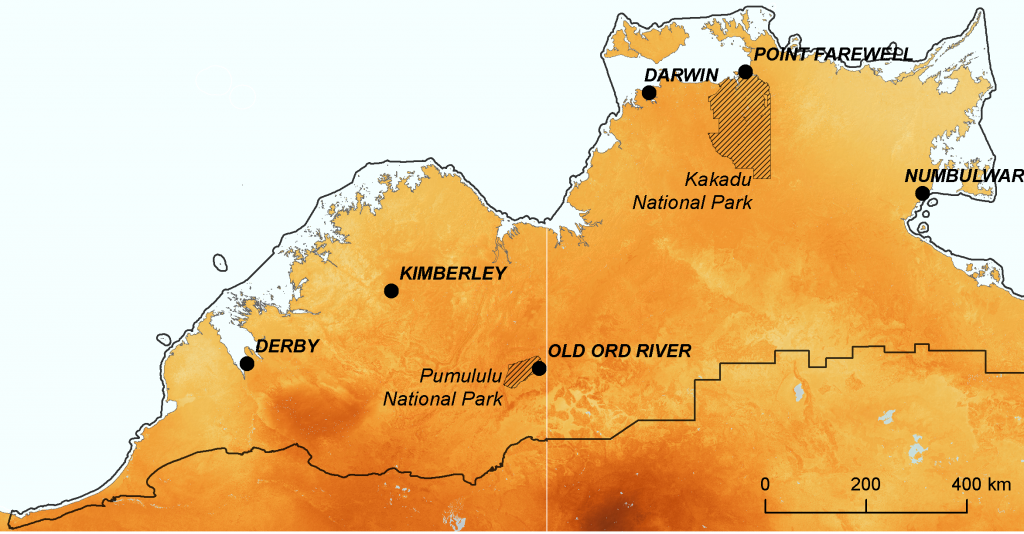
For example, the figure below shows the tendency for novel environments to arise in the north west of Australia under the high emissions’ hot CanESM2 climate scenario for all four biological groups. There is a tendency for vascular plant environments to become most novel around Kakadu National Park. Yet mammal environments will be most novel throughout the Kimberley, amphibian environments will be most novel southeast of Derby, and reptile environments will be relatively similar to those seen today. Collectively, these maps suggest that different species groups will experience changing climates differently. Thus, fauna groups (and not just threatened fauna species) may need to be included much more comprehensively in assessment and planning. The community-level models provided with this Module present an opportunity to begin doing just that, at least for mammals, reptiles and amphibians.
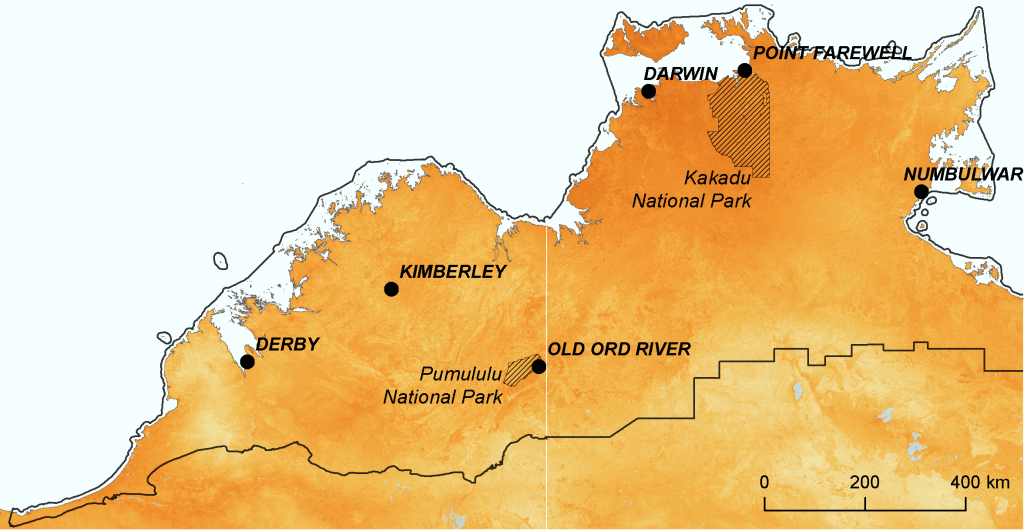
Vascular plants
Mammals
Reptiles
Amphibians
The degree to which ecological environments are becoming novel by 2050 in parts of northern Australia for all four species groups under the high emissions’ hot CanESM2 climate scenario. Darker colours signify greater tendency to become novel.
-
Climate change in the context of other threats
Climate impacts are commonly viewed as one more threat to biodiversity persistence on top of many others in the landscape. But it is often unclear the degree to which climate change will interact with existing threats and exacerbate the rate of biodiversity decline, or whether management of existing threats is simply more important than managing climate impacts. While other threats are usually added into a vulnerability or risk analysis as reductions to adaptive capacity (see above – Using the potential degree of ecological change in vulnerability analyses), the change in effective area of similar environments allows planners to incorporate interactions as well.
For example, darker colours in Figure C below show areas that currently support vascular plant environments that will lose (and have already lost) substantial amounts of effective area due to both past land clearing and the effects of climate change. This interaction is somewhat different than the effects of climate change only (Figure A) or just past land clearing (Figure B). Figure C could be used in a vulnerability analysis to incorporate interactions between climate change and land clearing, with other existing threats added as further reductions in regional adaptive capacity for plants.
Finally, drilling into more regional detail in these maps can reveal sub-regions where the consequences of climate change are actually greater than those of past land clearing (darker colours in Figure A than in Figure B). This is the case for much of the rangelands but also for sub-regions northeast of Nyngan, the Pilliga, as well as the northwest slopes of New South Wales. These areas highlight that for some parts of a region, a special focus on adaptation planning aside from just managing current threats may be warranted.
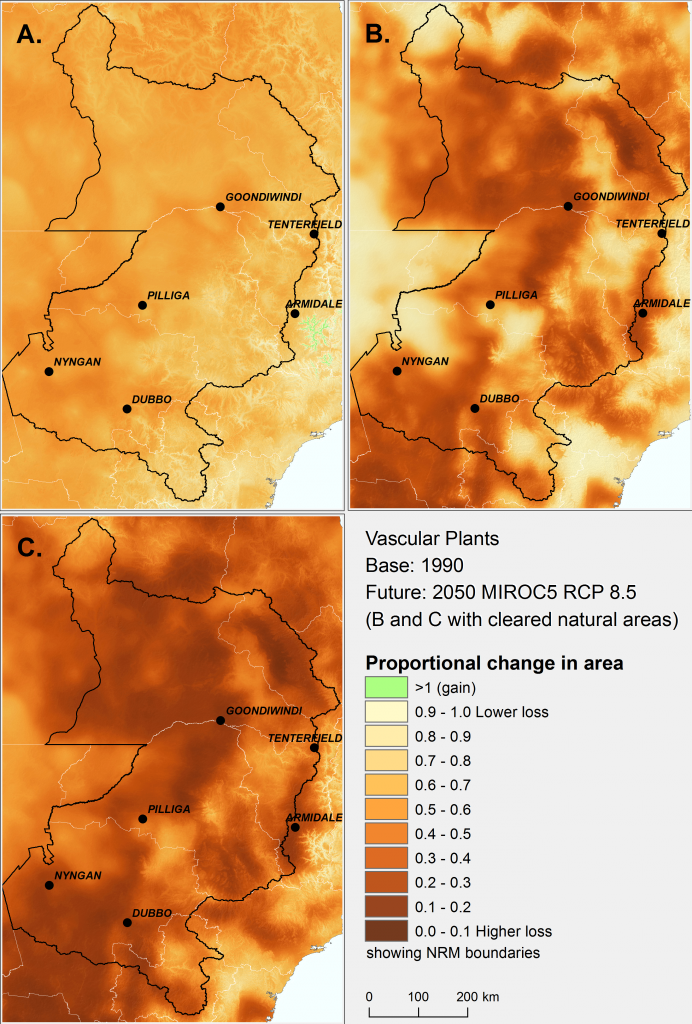
The change in effective area of similar ecological environments for vascular plants by 2050 in north-eastern New South Wales and south-eastern Queensland under the high emissions’ mild MIROC5 climate scenario. Darker colours signify areas greater loss of effective area. A) loss of effective area due to climate change, B) effective area already lost to date due to past land clearing, C) the combined effects of past land clearing and climate change.
-
Strategic planning for different types of vulnerability
The different types of vulnerability shown in the composite areas of ecological change maps for vascular plants could lead to quite different overall strategic goals. Green areas, for example, where less change is expected to occur could be supported by protecting and managing existing vegetation to retain its resilience. Novel environments, disappearing environments, and areas that are both novel and disappearing (red, blue and purple areas) may need strategic goals that are reframed to be less focused on the species and communities they currently support and more focused on facilitating the change to new environments.
For example, where novel environments may arise such as throughout the central Hunter Valley (bluish areas between Singleton and Muswellbrook), restoration to rebuild general resilience and connectivity along with monitoring of invasive plants could be most effective. Where environments are disappearing, no amount of strategic planning may be able to arrest that decline. If key species in these environments are deemed valuable, they could be targeted for more intensive conservation measures like ex-situ conservation. These consequences for strategic planning and implementation will be elaborated in the follow-on guide, Helping Biodiversity Adapt.
Interestingly, the area identified as likely to experience the most dynamic change in the Hunter Valley is also the area in which significant new mining developments are expected (between Singleton and Muswellbrook). It is the biodiversity assessment area of the Upper Hunter Strategic Assessment, which is designed to consider cumulative impacts of mining on biodiversity in order to plan to avoid, mitigate, and offset those impacts. The Composite areas of ecological change map for the Hunter Valley suggests that if the assessment is based on current vegetation types, there is a risk that it may not account for the amount of dynamic change in biodiversity expected in the region over the next few decades.
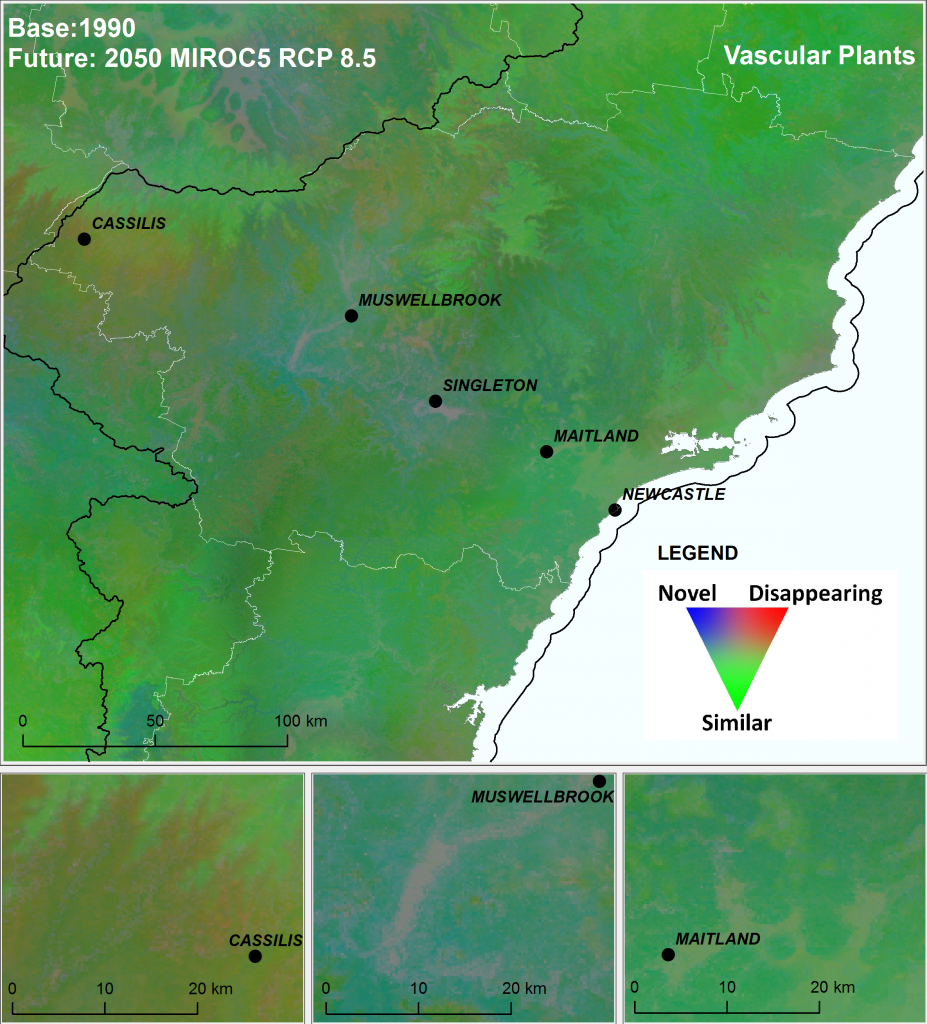
Composite ecological change identified for vascular plants under the high emissions’ mild MIROC5 climate scenario for the greater Hunter Valley region in New South Wales.