Revegetation benefit
- Revegetation benefit indicates how many more present-day species the landscape is likely to conserve into the future as a result of revegetation at a location.
- The benefit of revegetation is assumed to be greatest for ecological environments that are or will become rare, either naturally or due to human influences.
- The estimation of revegetation benefit uses the measure of change in effective area of similar ecological environments, which is applied to the baseline (1990) and the future (2050).
- The measure only applies to cleared natural areas, elsewhere no benefit is shown.
Click on the boxes below to explore examples at national and regional scales.
Find out more
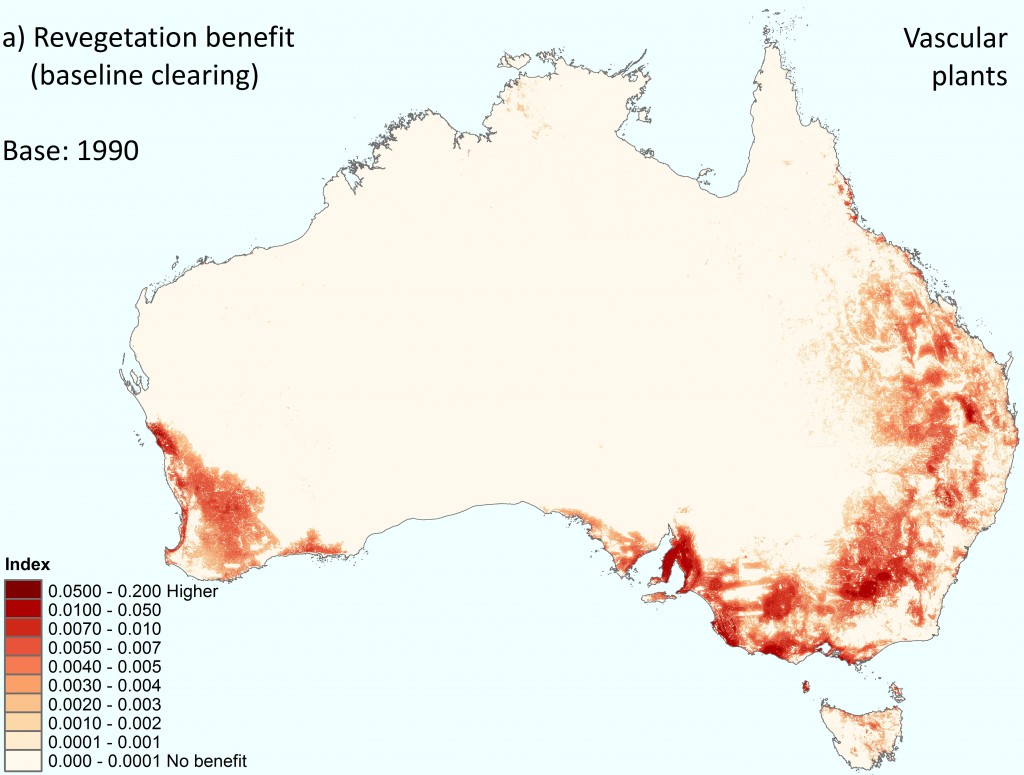
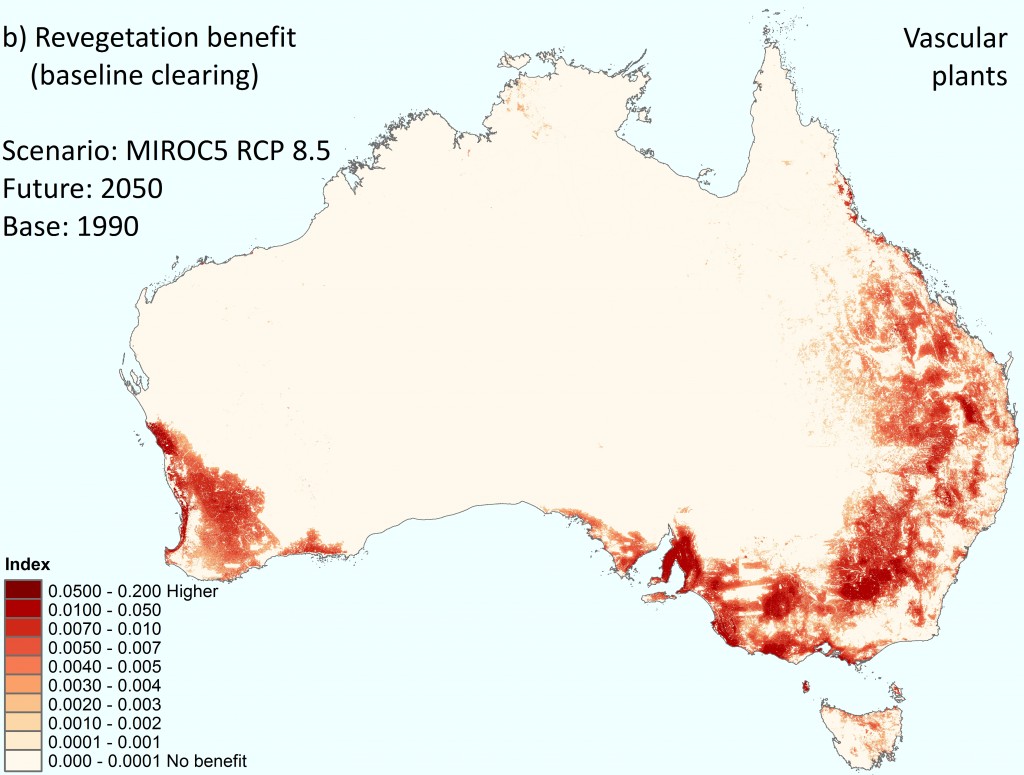
Open allClose allIn this example for vascular plants we see an increase in revegetation benefit from baseline (1990) (a) to the high emissions’ mild MIROC5 climate scenarios. The greatest benefits of revegetation at the broad scale accrue in parts of the south-east from the Yorke Peninsula to the NSW south-west slopes, and in the Geraldton area of Western Australia, concurring with some of the most highly cleared regions.


Revegetation benefit for baseline (1990) vascular plant species under the (a) baseline (1990) climate and (b) high emissions’ mild MIROC5 future climate scenario (2050). Darker colours signify higher overall benefit; lighter colours signify less benefit. While the legend shows 10 classes, the data itself is continuous.
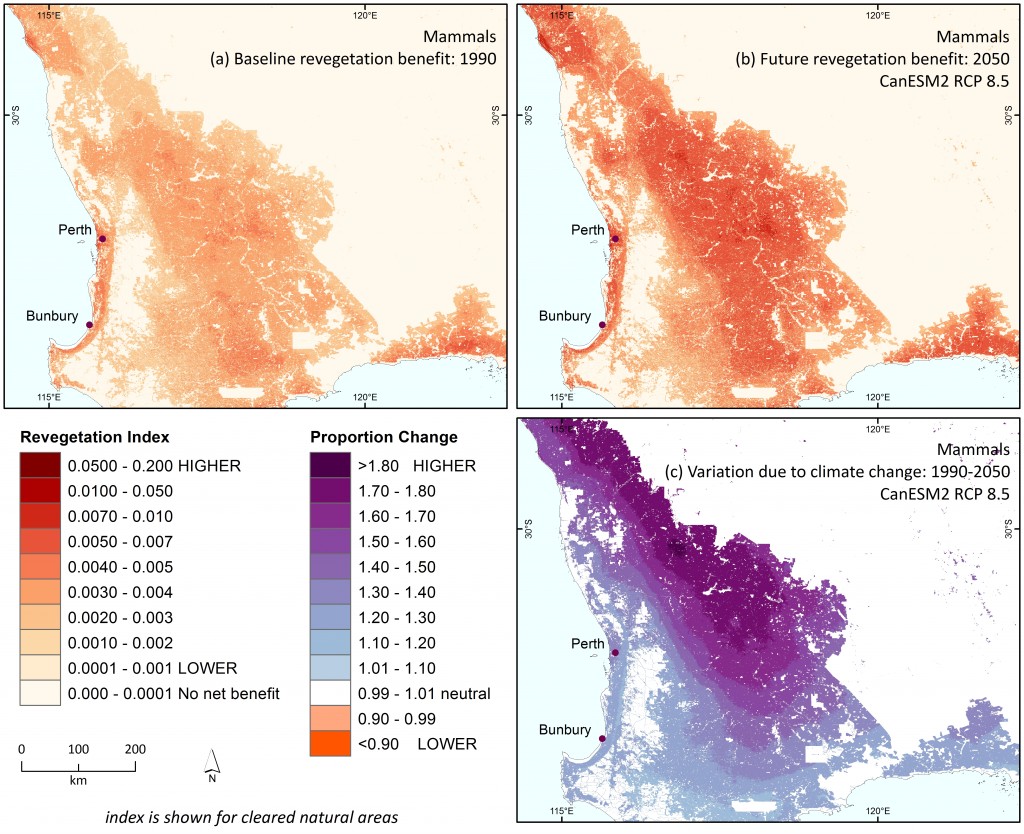
This regional example shows that for mammals in south-western Australia, revegetation benefit varies moderately across the region under the baseline climate (1990) (a). Under the high emissions’ hot CanESM2 climate scenario the revegetation benefit for mammals tends to increase by 2050 (b). However, the gain in benefit differs among locations (c), and hence incorporating climate change into planning might modify the way we prioritise areas for revegetation.

Revegetation benefit with regard to present-day ecological environments for mammals in the south-west agricultural zone (a) under the baseline (1990) climate, (b) for 2050 under the high emissions’ hot CanESM2 climate scenario, and (c) showing proportional change in accrued benefit under the future climate (calculated as b/a). A reduction in benefit due to climate change could also occur but none is evident here. This would suggest either an increase in available effective habitat area, or a low similarity between the baseline (1990) ecological environment and the future environment of the focal cell.
Ideas for using information on revegetation benefit in planning are available under Planning Examples.
