Projected distribution of vegetation types
- Measures of projected distribution of vegetation types provide a broad indication of the nature of potential changes in the distribution of Australian plant communities, represented mainly by vegetation structure or dominant species. They show where vegetation types may exist in the future and with what probability.
- To estimate change in vegetation type, we use the ecological similarity model developed for vascular plants.
- A focus on vegetation types can help support decision-making about which functional types of species to use in ecological restoration plantings, and whether to manage for the persistence of a vegetation type at a location or facilitate its transition to other types.
- Change in vegetation type can be viewed in two ways:
- Probability data: show probability of individual vegetation classes occurring (scaled between 0 and 1)
- Generalised data: show the vegetation class with the highest probability of occurring
Click on the boxes below to explore examples at national and regional scales.
Find out more
Open allClose allAt the national scale, under even the high emissions’ hot CanESM2 climate scenario, vegetation patterns are projected to remain broadly similar by 2050. However they are likely to shift in location, including some migration towards the south or coast.
Figure a shows the pre-clearing map of Major Vegetation Sub-groups (generalised to approximately 250m grid resolution), and Figure b shows how the model predicts their distributions for the baseline period (1990). Viewed continentally, the match is exceptional. The local details are less well replicated by the mapped predictions, but some of this detail can be revealed by examining the predicted probabilities for each vegetation class.
Figure c shows which of Australia’s Major Vegetation Sub-groups are projected with the highest probability for each grid cell by 2050 under the high emissions’ mild MIROC5 climate scenario, and Figure d shows projections for the high emissions’ hot CanESM2 climate scenario. Click on the image for higher resolution viewing.
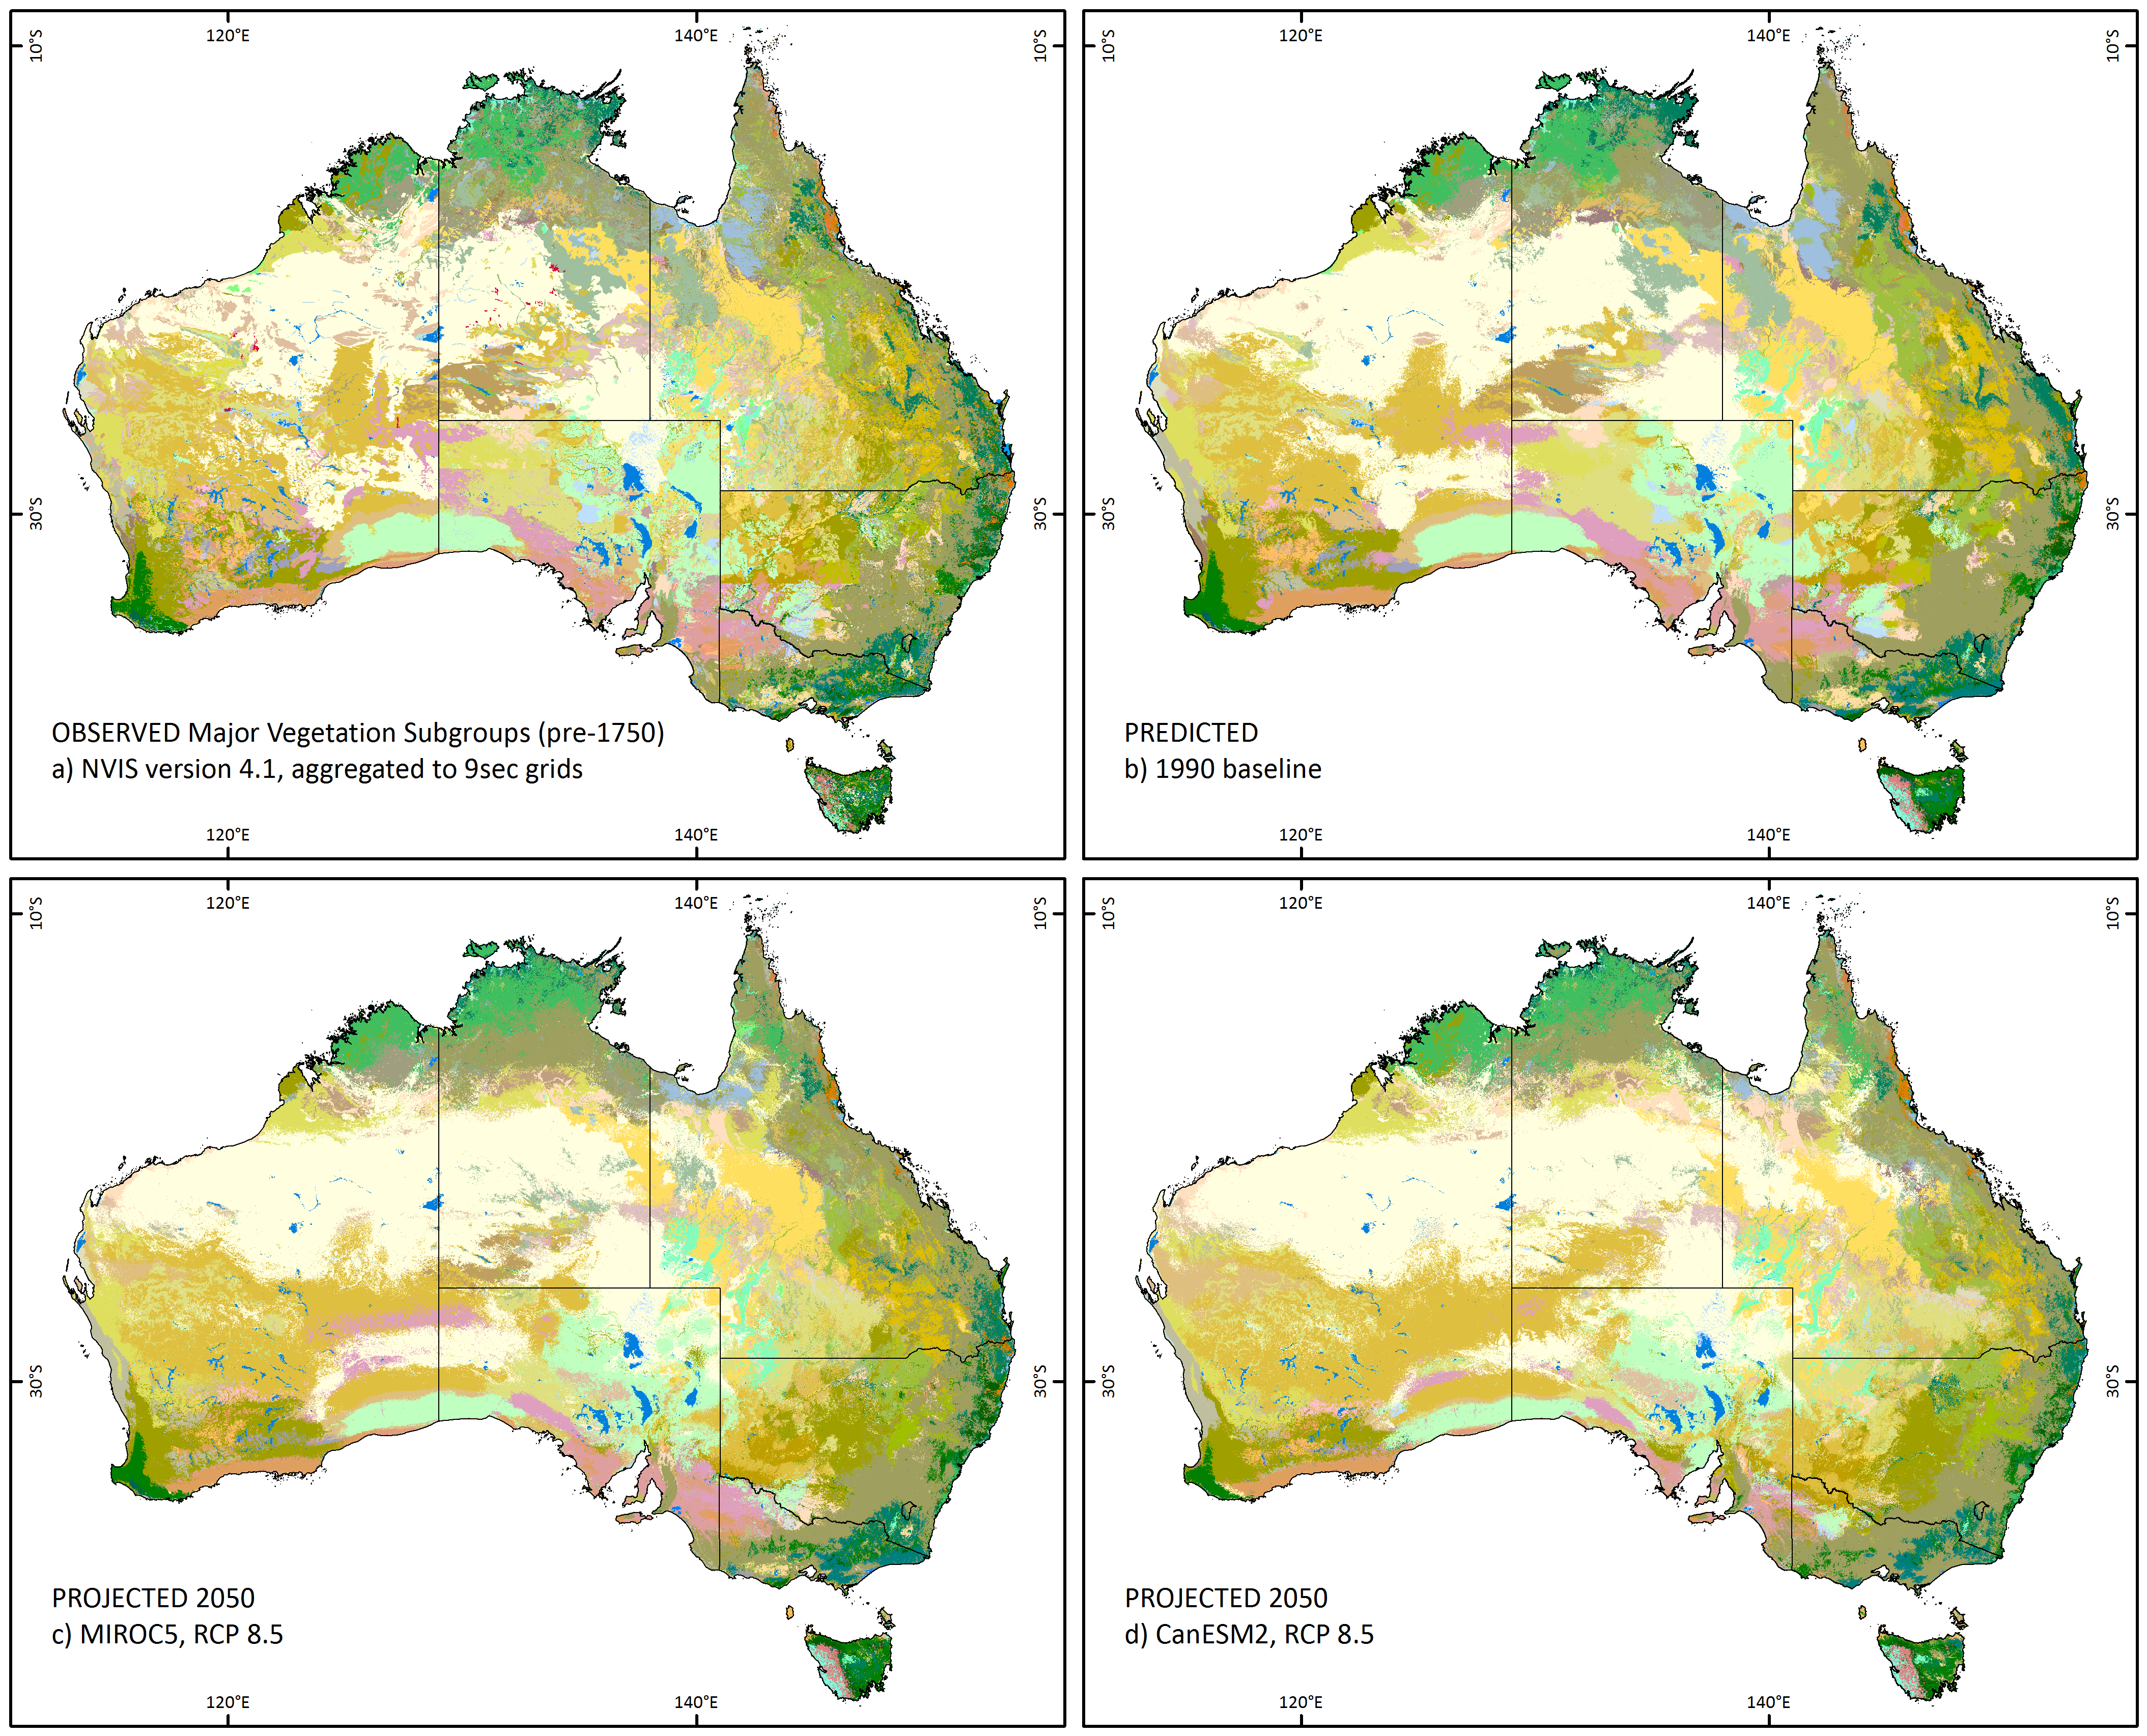
(a) Observed Major Vegetation Sub-groups for Australia, (b) model predictions of Major Vegetation Sub-groups for Australia in the baseline period (1990) indicating effectiveness of the modelling; and generalised maps of the projected distribution of vegetation types by 2050 for the high emissions’ (c) mild MIROC5, and (d) hot CanESM2 climate scenarios. Maximum probabilities underlying the generalised vegetation types and their associated number of vegetation types are shown in Technical Note 2 in the Guide.
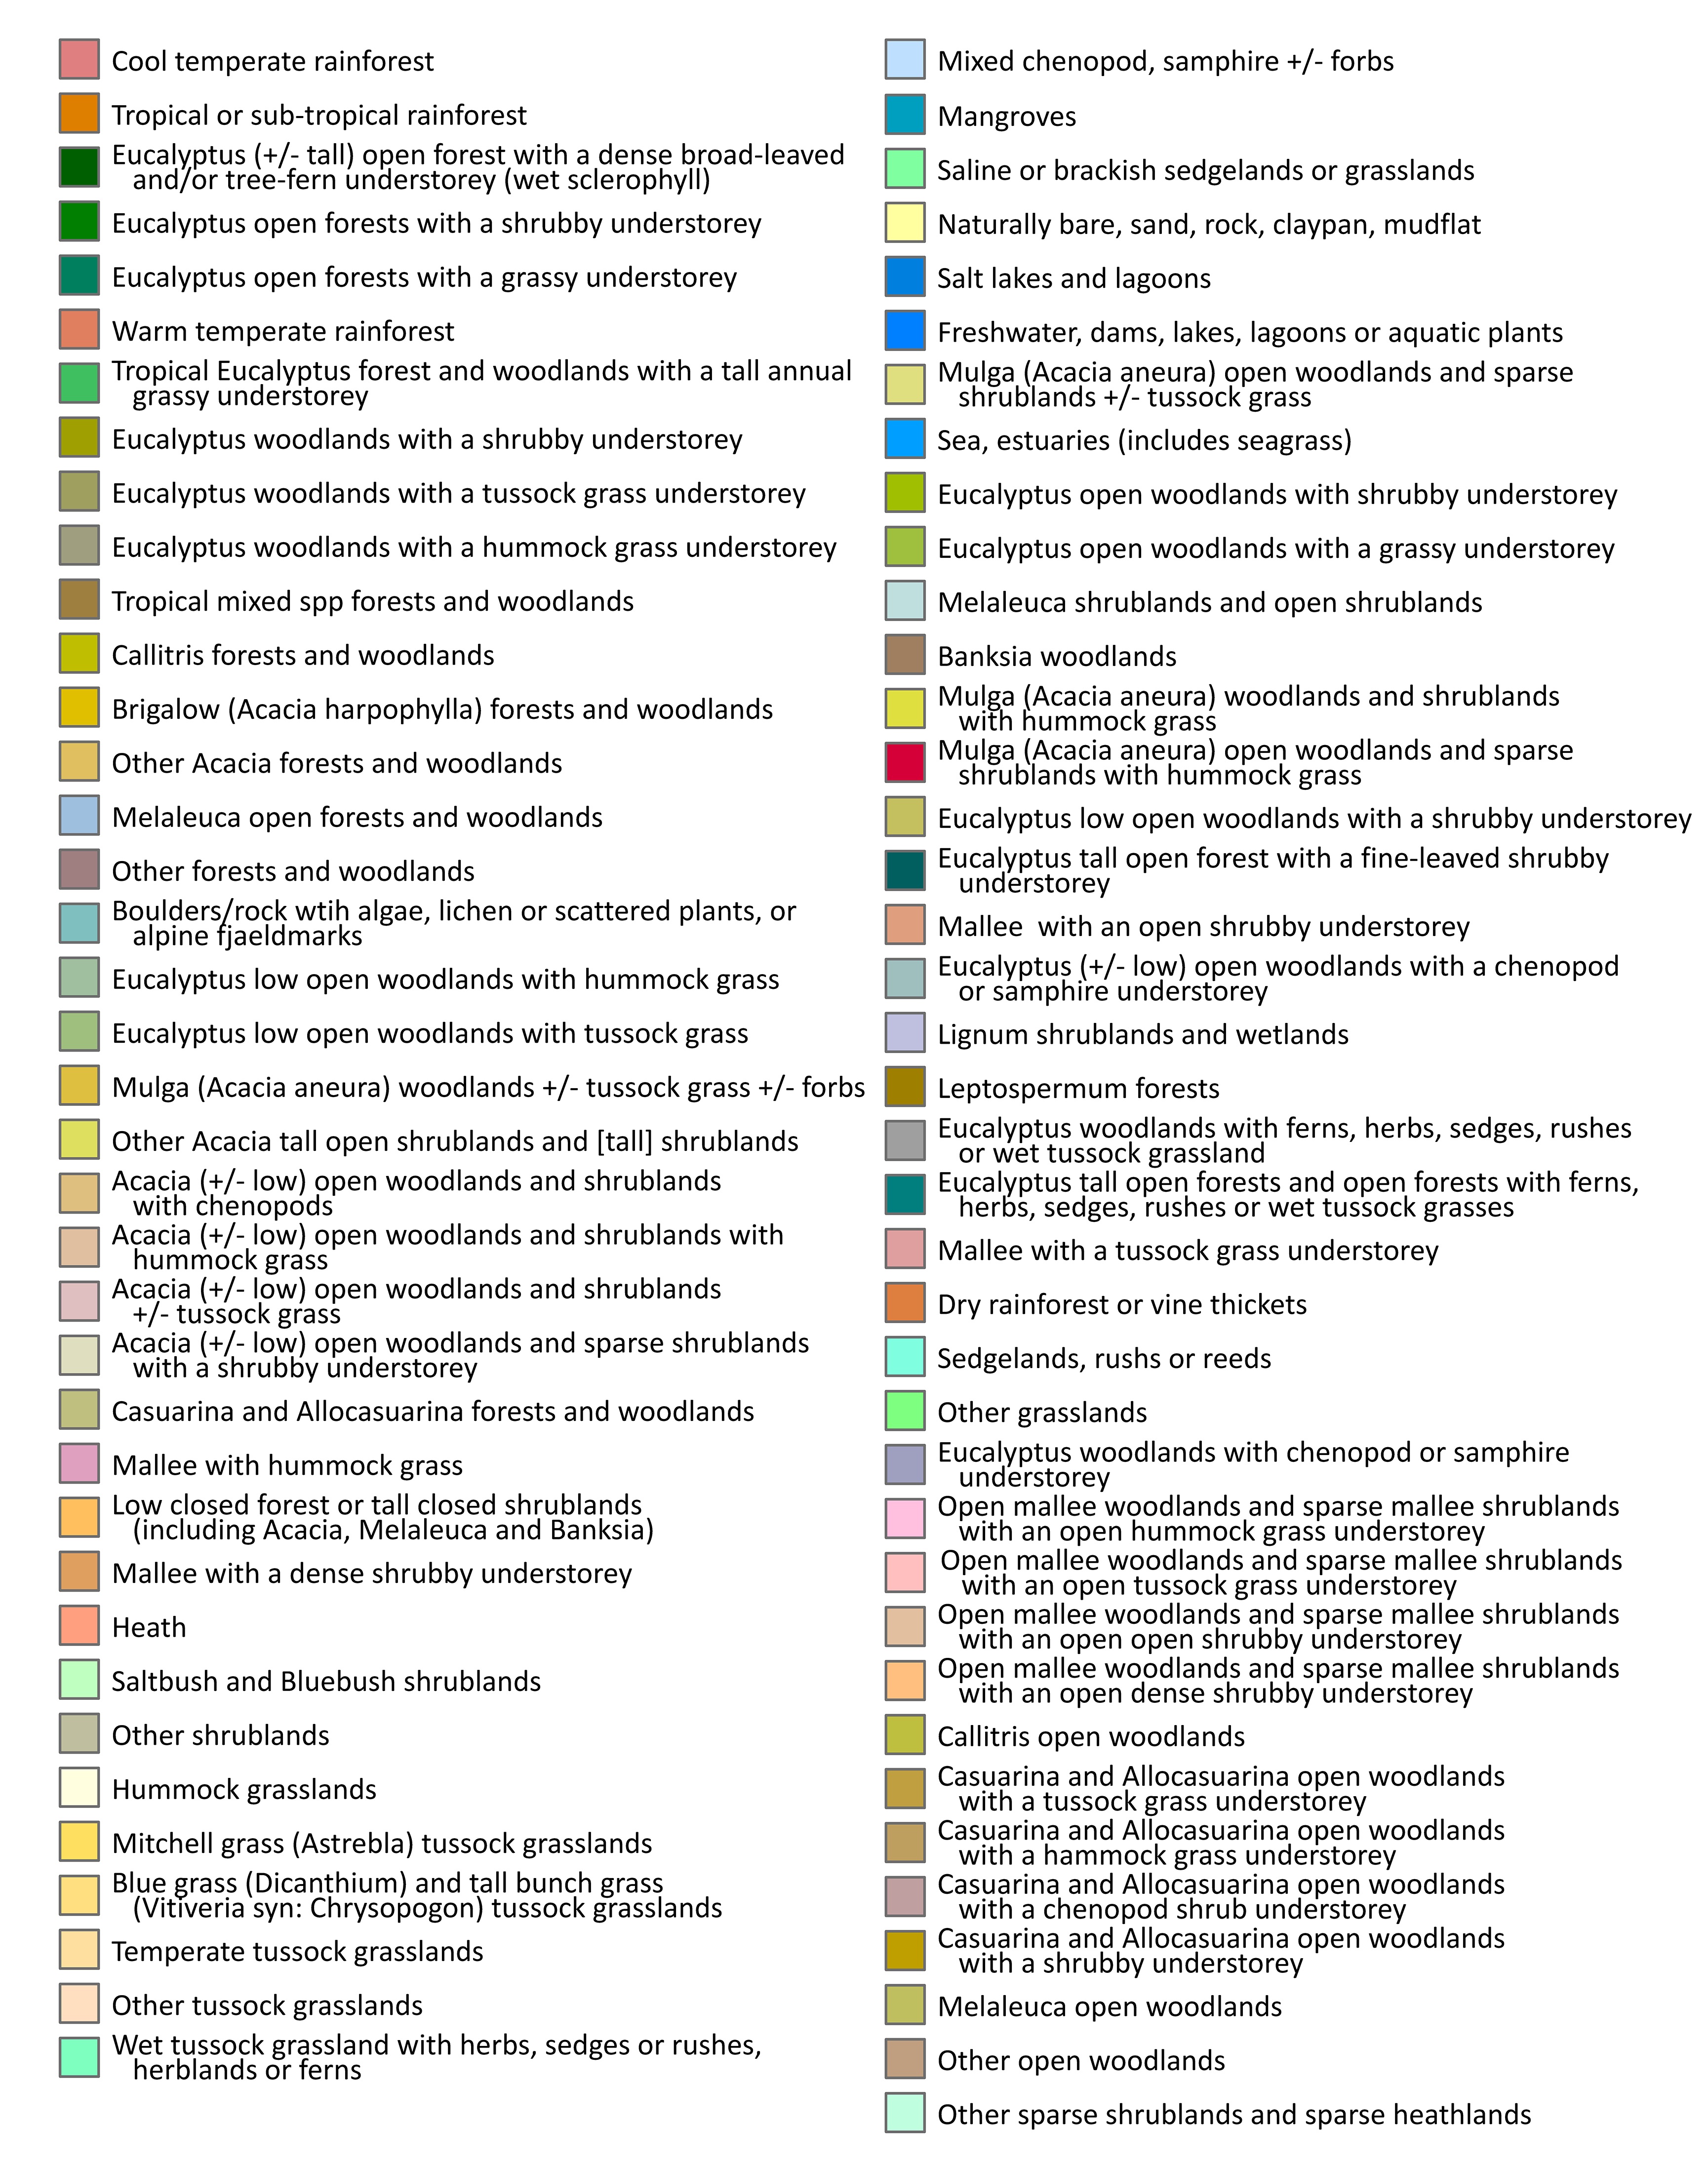
Legend – click to view
Vegetation types at any particular location are often expected to change. Understanding this change can help when prioritising management actions.
An example of the changes expected in central New South Wales is shown below.
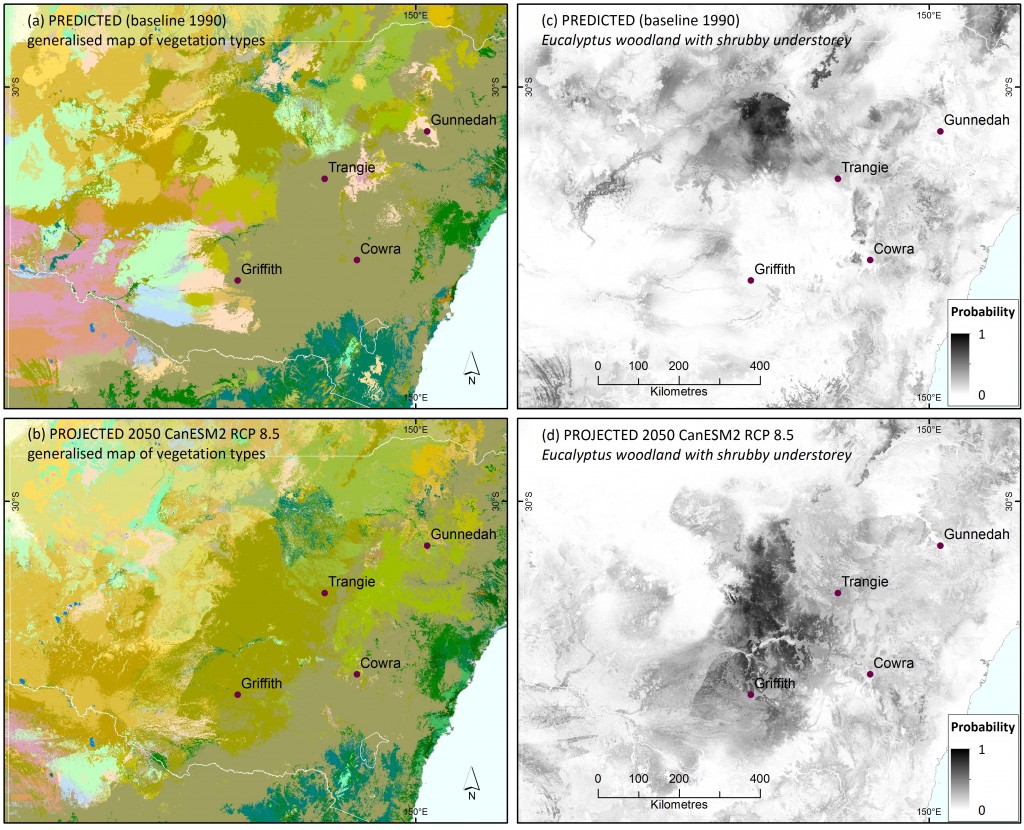
The colour maps show baseline (1990) observed (a) and 2050 projected (b) vegetation classes for central NSW, showing potential replacement of Eucalyptus woodland with grassy understorey (grey-green) with Eucalyptus woodland with shrubby understorey (olive green) under the hot CanESM2 climate scenario (full legend is shown in Figure 2). The grey scale images show the 1990 baseline predicted (c) and 2050 projected (d) probabilities for Eucalyptus woodland with shrubby understorey, highlighting the potential southward spread. The probability maps also indicate uncertainties, such as low probabilities for shrub woodland around Trangie despite its projection as the most probable vegetation class on the generalised map
The projected generalised distribution of vegetation type map for the high emissions’ hot CanESM2 climate scenario suggests environments most suited to grassy woodland will be replaced by environments more suited to shrubby woodland across extensive areas, from Griffith to Trangie.
This indication of potential structural change suggests that some woodland species, including birds that favour a dense shrub layer (such as many fairy-wren and thornbill species), may benefit from climate change. On the other hand, ground-layer wildflowers, and birds favoured by grassy understorey, would be disadvantaged.
Ideas for how to use the projected distribution of vegetation types in planning, and how to interpret the probability data versus the generalised data, are available under Planning Examples.